As the 2022 U.S. midterm elections near, the Reuters Graphics team is preparing an innovative set of election graphics for Reuters News Agency customers. Building on the success of the 2020 presidential election graphics, which generated more than 80 million page views from Reuters.com and media clients, Reuters Graphics will develop a robust application that will chart election nights results for every race in the U.S. congress, as well as governors’ races, in real-time.
Reuters election results graphics are powered by data provided by the National Election Pool. Reuters is also the exclusive distributor of NEP election results data; Reuters News Agency customers can purchase fast and accurate real-time results and exit polling via a distribution collaboration with the NEP.
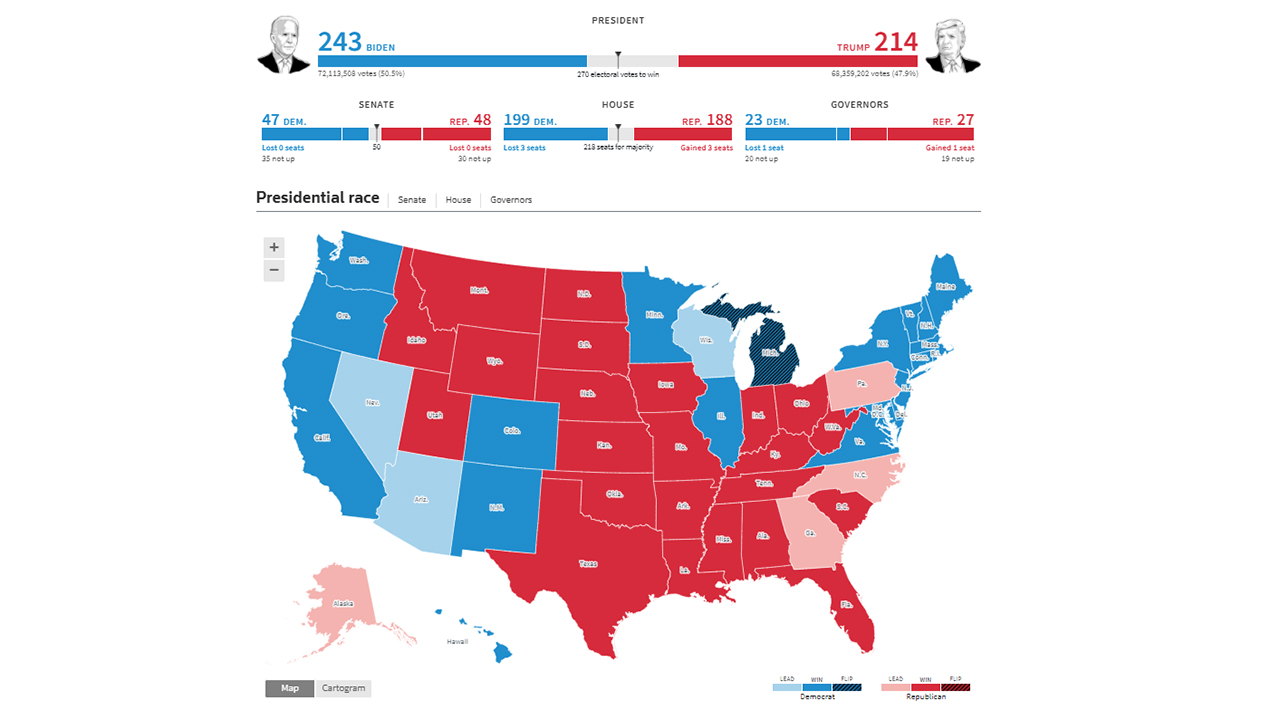
The Reuters graphics will feature maps, tally bars, and tables sorted by race competitiveness. Interactive elements will give candidate names, the percent of expected vote counted, current tallies, and clear indicators showing which races have been called and the balance of power across government.
They will also map counties, states and complex numerical data, as well as show helpful live estimates of votes, all of which help relay important complex information to a reader. “It’s easier to keep the reader’s attention using graphics. You can digest it better than written text, as our brains tend to digest visual information better,” said Matt Weber, Global Head of Graphics at Reuters.
“A good graphic can tell a reader at a glance the broad strokes of what is happening and the larger trends at play. A great graphic will further provide fast and efficient navigation to the granular data that is important to that reader specifically.”
“The Reuters election night results graphics achieve both these goals through nuanced design and consideration. Balance of power bars give the broadest sense of the state of the race,” Weber explained. “Maps and cartograms allow a reader to zero in quickly on the races that are important to them. Zoomed in detail reveals more granular county level data. Detailed tables sorted by competitiveness shine a light on any surprises or major upsets.”
Ahead of Election Day, the Reuters Graphics team is also tackling issues such as the economy, crime, climate change, immigration, healthcare, inequality, public health, terrorism, and education via the Reuters Polling Explorer. The graphics also highlight the state of the races and the president’s approval rating across demographics including race, education, gender and income through a thorough analysis of data-rich polling and easily digestible graphic explainers.
Conducted by Reuters and Ipsos, the Reuters polls reflect the opinions of the American public and allow users to gain detailed insights and view and interpret results across the issues that matter to them most.
For more on Reuters U.S. midterm elections offering to News Agency customers, visit Reuters U.S. Elections Resources Guide
Media contact: alaa.alsamarraie@tr.com